Category Archives: systems

Adventures in Homeschooling: Fun With Arrays

As we transitioned to math activities that were more engaging for my kiddo, I started to notice similarities and patterns. At this point, I was using the book Moebius Noodles as our primary inspiration for math activities. For example, we would have a lot of fun playing around with body symmetry exercises, where one person mirrored the other. We would estimate height by guessing and then building a tower with Duplo blocks. The tower would inevitably collapse, leading to lessons about structure and making a solid base. We played a “program Dad” game where he would direct me around the house by telling me exactly what to do. We found that using a checkerboard tile exercise mat helped a lot. For example, kiddo would tell me to move forward three squares, then turn one square to the right. We played around with grids, working with numbers or drawing items within the shape.

I am a programmer, so playing with grids make me think of arrays. Arrays are used a lot in programming languages as handy data structures. You can use them to store and access objects that you want to interact with in a computer program. When I was learning about arrays in programming, I found simple examples made sense, but when you added more dimensions or started thinking about performance, I struggled. I had trouble with thinking in abstractions. It took a long time to overcome that. The actual concepts, code and mathematics were simple, but my brain struggled to think about something virtual with different dimensions. Similarly, when I started a linear algebra course, I spent too much brain power getting my head wrapped around how arrays were formed, and keeping track of what number was in what row or column. The actual math was often elementary level, but the abstractions were difficult to grok. I felt that adding in thinking about more than one dimension, and thinking about abstractions in math would help my kiddo develop better math skills. If he could get used to thinking about abstractions I wasn’t exposed to until I was in my late teens, what would that do to his problem solving brain?

We would also look for array patterns around the house. We would examine Duplo and Lego bricks, muffin tins, egg cartons, game boards, crayon organizers, drink holders, watercolor paint trays… the list goes on. There are array shapes everywhere, and we would find them and discuss them. What pattern do they make? What could we call this in math or programming? Soon, kiddo was spotting array patterns himself and pointing them out. Next, I wanted to add a bit of structure to his thinking about arrays. To make things more interesting, I would ask him to identify the rows (horizontal) and the columns (vertical). We would play around with that concept. For example with an egg tray, it is natural to set it down so that it has more columns than rows, because that is how it is labeled. But what happens if we turn it so it has more rows than columns? We would identify an egg and its location: 3rd row, 2nd column, and then move the egg tray. Now it is 2nd row, 3rd column. Did the egg change, or did the “address” of the egg change? Turns out the egg is the same, but the way we describe to find that exact egg can change, depending on our perspective.

Games and Arrays

Since kiddo could easily count to 30, he could easily keep track of rows and columns in a 10×10 array. I printed out a 10×10 checkerboard and we started to play with it. I would ask him to help me determine where the rows and columns were. This took some practice, and I told him that when I was taking linear algebra in university, and then later when I worked with tables in HTML, I would remember that columns were vertical, like columns holding up a roof. Rows I remembered as horizontal, like rows on the ground in a vegetable garden. Columns hold up, rows are planted on the side. Next, we would count, making sure we kept track of the row number and the column number, which is the “address” or location in the array. Once kiddo could identify rows and columns on his own, and find a location when prompted, we started to add complexity.

I would set the checkerboard down, and ask him to locate row 2, column 3. He would take his finger, and count down to row 2, and then he would move his finger 3 spots over. While my brain was thinking of patterns in applied math, his brain was spotting a familiar pattern: games. We transitioned from counting and pointing to making simple games together. Every morning, we would take out the checkerboard, and we added in dice and game play pieces. Using dice meant I needed to expand the size of our array to 12×12. Next, for playing pieces we found Lego bricks, bingo chips, and other objects worked, but we settled on mini ring fidgets. These worked best because they weren’t associated with anything else that distracted us. From there, we would take turns rolling a single die. We both started at top left, just off of the grid, and after a roll, you would count forward to match the number on the die and move your playing piece to that position. We would move row by row from beginning to end. The first person to get to the end won.

Next, we added a die so we had a pair, and rolled both dice at once. The number on the left most die represented the row, while the next number represented the column. Instead of moving through the game board from the first column and moving through from row to row, you had to keep track of the row/column pair. This added a lot of randomization, and could cause someone who was “winning” to get knocked back. Now we were thinking and playing and having more fun. To add more randomization and surprise, kiddo would add in extra objects. If you landed on a Lego brick, you had to count the rows/columns of the brick and move to that spot on the board. If you landed on a different colored fidget ring, you had to start over. If you landed on a smiley face sticker, you could skip to the end. Now we were having a lot more fun, but it was hard to “win” because of all the randomization. To move beyond this, I added in two variations. The first was to get him to create the activities from scratch, and the second was to add in zero-based counting.

We were playing with the emerging array game every weekday morning. We would set up on the floor, and we would play around and have fun. When it started to get stale, I asked him to run the sessions. At first, I just had him tell me the rules of the game, and explain how everything worked. It was often muddled, the rules would change to favor kiddo and disadvantage dad, and the lessons about arrays were completely lost. However, I was pushing for engagement rather than mastery, so I didn’t care. On days when I ran the game, we did it according to rows and columns and reviewed what we knew about arrays. On days he led the array games, whatever happened was what was supposed to happen that day.

At first I was concerned he wasn’t taking anything away from the lessons, but when we played the game the way I had set up, he seemed to grasp the concepts more firmly. The random play was reinforcing what I was hoping he would learn. Even though he wasn’t playing by “the rules”, he was exploring the boundaries and being creative. Math lessons aside, creativity with designing your own game with dad has tremendous value on its own. It was actually reinforcing the lessons, even though it didn’t seem like it at first. He was truly owning the concept and chasing down ideas he had as things in the lesson reminded him of games we played, video games, following recipes in the kitchen, etc. There were also disagreements and lessons about playing fair, being a good sport, and other important issues. It was hard at first to not correct and bring him back to the topic at hand, but I found his brain was working on it, even if I didn’t see it at first. If I could just shut up and be a 5 year old with him in the moment, good things came out of it. I realized he was doing what I was hoping for anyway, he was applying the math. He was taking the theory and making it real.

The next variation was to make it more difficult, and to keep track of rows and columns using zero-based counting. One of my frustrations when I was programming was having to switch my brain from starting at “1” to starting at “0”. Many programming languages use zero as the first number, and I found it hard to adapt at first. When I taught adults to program later on, many also struggled with this. Instead of using your programming brain, you were expending energy trying to count to 10 starting at 0. With kiddo, I am a stickler for starting counts at zero, not one. It makes everything easier for him to have that solid grasp of zero. It helped him with place values, with counting, and it helps him with simple arithmetic. Understanding zero also helps with abstract concepts as well. Since he was familiar with starting to count with zero, and using place values to increase or decrease, transitioning from 1 to 0 based counting for arrays wasn’t that much of a stretch.

Arrays and Muffin Tins

To make this come alive, I looked for kid friendly array activities to explain this better than I could. Unfortunately, I couldn’t find anything online other than identifying arrays and looking at rows and columns. Good activities, but not what I wanted. I wanted kiddo to start thinking about arrays as an abstraction, but add the realism by keeping track of rows and columns to access something stored at each address. I wondered about a cardboard fold out activity, like a mailbox. I talked to a programmer friend, and she said her daughter had worked on a “muffin tin” math activity. Each indentation in the pan was covered with cardboard, and the kiddos would take the top off to discover items in each section of the tin. This is easy enough to do, why couldn’t I do that with arrays?

A muffin tin with paper addresses for each element in an array. It starts with 0,0 at the top left and ends with 4,3 at the bottom right.
A muffin tin set up like an array with numbers representing rows and columns.

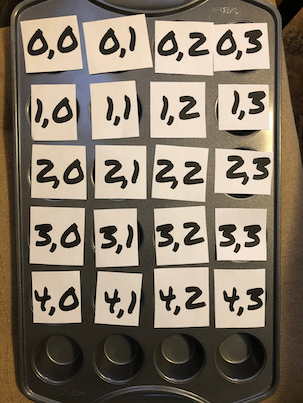
With a bit of thought, I came up with a simple activity. I printed out slips of paper with a pair of numbers to represent the row and column, which would cover the indentations of a muffin tin. Under each address, within the muffin tin indentations, I put in a small toy. I started with Lego pieces and one Lego character. Next, I asked kiddo to find the Lego character. He needed to lift up the paper that had the row/column location, look underneath, then put it back and move on. Finally, he found the Lego character. I asked him what row and column he found the character at. Unfortunately, the location papers were scattered, so we repeated the activity, but with more care this time. To add interest, I changed the location of the character, and asked him to write down the row and column on the paper, once he had found the character again. This time, it worked. He was starting to engage. To increase engagement, I turned my back, and asked him to put the character in a new location, and then I would have to find it. He started to have fun.

Kiddo hid the Lego character at a location, and put the paper locations back on top of each indentation. Trouble was, they were out of order. Instead of pointing this out, I pointed along with my finger by moving by address, rather than physical location. Instead of starting at the top corner where 0,0 should be, I started where 0,0 actually was placed, which was somewhere else on the tin. Next I found 0,1, then 0,2 and so on. Some where in the correct location, but some were not. I feigned surprise and said I was confused. Kiddo patiently explained I should start at the top and work my way down. I suggested that if that was the case, he needed to make sure the addresses of each tin indentation was in order. He quickly shuffled the papers around so that the muffin tin rows/columns matched correctly. I then started and worked my way through until I found the Lego character.

We took turns with this activity several times, and he had lots of fun. He would try to surprise me with the location of the Lego character by putting it in the last position so I had to count all the way to the end, or at the beginning so I found it right away. He would put it back in the same location, or he would try to distract me by saying something funny while I was moving through each item. There was a lot of giggling, and when the papers with the row/column addresses got mixed up, he was quick to help sort them again.

The next day, I asked him to set up the muffin tin activity. His job was to put items in each indentation, and then put the correct address slip of paper over top, in order. We had a couple of oopses with 0,0 and 3,4, but with some clarification he remembered how it worked. This time however, we got Mom to hide the Lego character, and then we took turns trying to find it. To begin, we both started at the top left and worked our way through. The next time though, I surprised him with an algorithm. When it was my turn, I didn’t start at the beginning, I started at the end. Then I switched back to the beginning, then back again and so on. I found the Lego character first, since I was using a consistent approach. Next, I checked at the end, then the middle, and then moved back and forth from middle to end, and once again, I found the Lego character first. Kiddo was disappointed and feeling a bit frustrated that I was winning. He accused me of cheating.

This turned into a wonderful teachable moment where I could explain algorithms.

How do you explain algorithms to a 5 year old? The simplest way to describe it for him was that it was a set of steps to solve a problem. We looked at recipes for food we had prepared together, we looked at Lego instructions, and we looked at simple school assignments. Next, I explained what I was doing, that I was using a strategy called Binary search to find the Lego character faster. Since the array is small, it doesn’t give me much of an advantage, but I had lucked out by winning twice in a row. That had piqued his interest. I then explained that he had intuitively used a good algorithm, linear search, and that had worked well. He had started losing the game when he got excited and stopped concentrating. Instead of using a linear search, he was using a random search which is the least efficient. He might choose the same wrong address several times using a random search. That’s not efficient, or as effective. It is more effective and efficient (ie. find the Lego character faster) by using a consistent strategy.

A consistent strategy to solve a problem is another way to think about an algorithm. When you start to lose discipline due to emotions or getting distracted, your problem solving suffers. It’s harder to keep track, it’s easy to forget, and an opponent with a consistent approach will play better.

To reinforce the algorithm idea, we worked together on using each search algorithm. Since it is a small set of data, both linear and binary search were effective. He wanted to try binary search, so we worked together on finding logical places to divide up the data, and then work within those divisions. For example, he might look at the last address first, then look at the middle address. Next, he would move between those two addresses with each turn. He might then change tactics and try a linear search from the first address to the middle. This is a bit tricky for a young mind, because kiddo has to keep track of rows and columns, as well as the artificial divisions we were making in the grid of the array. To help keep track, we used pencils or longer Lego pieces as placeholders.

After a few days, kiddo was doing really well with the muffin tin array game. He was using a strategy to choose an algorithm, and he was comfortable with zero based counting. One day I sat back and watched him. I felt amazement and joy watching him. Not only was he demonstrating a basic understanding of arrays, but he was thinking about computer programming on his own terms. This applied math, or the “why” is absolutely crucial in learning. It was within his skill level, it was relevant to his interests, and it was fun for him.

We do programming work because kiddo has an interest in it. The TedEd Think Like a Coder series was particularly interesting to him. He had discovered this series on his own, and he looked forward to new episodes when they were released. Each episode prompted a lot of discussions about coding and me trying to replicate what they were doing in the story for him on my own PC. Sometimes I would struggle, and remembering to show him my mistakes, we would talk about how my code wasn’t working, or when I needed to look something up or ask for help from a colleague with better coding skills.

Programming is also an easy place for me to answer applied math questions, and to talk about day in the life applications of math. Sometimes the only way I can start to answer a “why do we do this” question is by working it out in code to show him an example. No, we don’t learn math for no reason at all. Yes, some people work with math every day.

Making it Real With Code

Looking at array addresses of rows and columns as zeroes felt arbitrary to kiddo. While he understood it and got it right most of the time, it really felt like one of those “grown up” things that didn’t make a lot of sense. Isn’t zero just another way to describe “nothing”? To help with this, we worked together on our home address vs. that number represented as a quantity. Next, we looked at my phone number, and then represented it as a quantity. Then we added some numbers together, which made a sum. What was different? Kiddo explained that the number in our home address and in my phone number stood for something unique, so people could find it or phone me. But a quantity was an amount of objects. A sum was calculating the total of groups of objects. We played around with this concept for a while, and stuck to the idea that an address for your house is a sort of unique label. Our neighborhood has free standing mailboxes that are labelled with a unique number that is assigned for each house address, and the contents are accessed by a key. To get the mail from another part of the world to an individual here, depends on various unique number labels.

Next, we looked at array addresses. We aren’t counting items, we are using the location in an array as a unique label. When we use zero-based counting, “0,0” is the first box in a grid. If we use one-based, “1,1” is the label. But what if we used names? How about emojis? Could we use sounds? Absolutely! We could use anything at all, really. However, number labels that follow a logical pattern work well. They are efficient and effective since they are easily understood.

To take this further, we opened up a language interpreter on my PC called irb, for the programming language Ruby. Kiddo had visited a local fish hatchery, so I typed in the following:

fish_array = ["trout", "pike", "perch"]

I explained that this was a simple array of words for fish. We read through them together I asked if he could help add in more. He suggested “walleye”, “goldeye” and “sturgeon”, so I added them to the array. We now had this array of strings, or words for fish:

fish_array = ["trout", "pike", "perch", "walleye","goldeye", "sturgeon"]

Next, I told him that I was going to use a bit of code to access the first fish in the array. I typed in:

puts fish_array[1]

and the interpreter printed this to the screen:
"pike"

“Aha! Dad! That’s not the first one!”

What do I need to do to fix it?

“You need to type ZERO, NOT ONE!”

I changed the code and tried again.

puts fish_array[0]

the interpreter printed this to the screen:
"trout"

That worked! You fixed the bug!

Kiddo really enjoyed this. We were controlling the computer, and it was important to keep track of what you were doing, because one simple error could give you the wrong answer. I explained that in computer programming, we often call this an off by one error.

We played around with this for a while, adding in array indexes that didn’t exist, to see what error would be produced. Then, I created a larger array, and used an iterator to print through each item, rather than typing in an address. Kiddo liked the idea of looping, we could do things quickly and efficiently, and you didn’t necessarily have to figure it out yourself, you could get the computer to determine what was correct for you.

We had fun. He wasn’t learning these concepts, but I was exposing him to some simple programming basics and explaining what we were doing. He had opinions and ideas about the content of arrays, and what to print out, and I would follow his lead by adding in conditionals, branching, etc. He then asked an interesting question. Essentially, he wanted to know if we could have an array that was made up of arrays. “Of course!”

I muddled around in the code to generate an array made up of arrays, and showed him how we accessed elements in an array of arrays. This started to look to him like our muffin tin game, since we needed to keep track of more than one index or address number. After a while, we had the code looping through each array within the array and printing things out, but that was getting complex and he was getting tired.

I sat back and I felt a bit shocked. Here we were, playing around with concepts I had struggled to learn when I was nineteen or twenty, and my 5 year old kiddo had grokked the basics. He could follow the form, he could play and have fun, and he understood that things could be stored in arrays, whether they were in muffin tins or mailboxes (physical), or in computer memory (virtual).

I SLICED UP FUN Mobile Testing Infographic

Twelve years on since I created and shared the mobile testing mnemonic I SLICED UP FUN, I see that people are still using it and finding it valuable. I still use it myself on projects, so I decided to create an infographic to make it more shareable.

I call this a mnemonic because it is a memory aid to help me with my work. A catchy phrase helps me remember everything I need to think about to be thorough when testing mobile apps. Sometimes these are called heuristics, or listicles. Whatever you want to call it, it’s a helpful thinking framework to help quickly generate lots of useful testing ideas.

I SLICED UP FUN is a testing framework for mobile apps, but I use it for more than testing. As a product manager I use it in a generative or creative way as well, not only to help evaluate an existing app design, but to create something new.

If you haven’t used a thinking framework like this before, it’s quite simple to use. Read each section, and determine which ones apply to your product. If a section doesn’t apply, skip it and move to the next. Once you have a list that is applicable to your work, use each item in the list to generate ideas for that category. Once you have a few relevant ideas under that section, move to the next. Then review what you have, and see if there are gaps. Whenever you’re able, include other people to help you generate more and better ideas.

Once you have generated enough ideas, put them into action, whether it is testing, design, or other work you need to do.

You can download the infographic here:
ISLICEDUPFUN mobile testing infographic

Load Testing Your Web Infrastructure: Please Be Careful. Part 4

Earlier, we looked at different ways that load testing can go wrong, if you aren’t informed, or if you don’t know what you’re doing. In part 1, we talked about a well meaning person who inadvertently created meaningless tests. In part 2, we saw the disastrous effects of someone with a little knowledge creating a mess. In part 3, we read about what can happen to a network if you unleash load tests while other people are working. In this section, we will talk a bit about some of the underlying math we need to use with load and performance testing. (On second thought, “underlying” is a bit misleading as a term, it is actually foundational, but it’s also lots of fun. It’s fun, even for math phobics, as long as you get help from time-to-time.)

NOTE: I am simplifying the math descriptions here for brevity. If you are a stats expert, please don’t be offended by my glossing over the details. The point here is to provide a basic amount of information so people get the gist of it.

What? We Need Math?

It’s one thing to generate load and point out potential issues, but the real key to performance and load testing is an understanding of probability and statistics. A lot of problems are uncovered through basic statistical analysis, and reports on this testing are also used to help with forecasting, service commitments and purchase decisions. Communicating anything useful and actionable about performance requires stats and probability knowledge and skill. It’s important to highlight that generating load and successfully taxing a test system is the easy part of load and performance testing. The hard part, and the time consuming part is to figure out what the results data is telling us, or not telling us. This requires a working knowledge of statistics, including:

  • Averages
  • Means, Medians, Modes
  • Standard deviation
  • Confidence intervals
  • Distribution types: normal vs uniform
  • Statistical significance, equivalence, and outliers
  • Percentiles
  • Probability

It’s also important to have a good knowledge of elementary math:

  • Addition and Multiplication
  • Exponentiation
  • Combinatorics

You don’t need deep expertise in these concepts, but a working knowledge is important, as well as the ability to work with these concepts in popular productivity or math tools.

It’s one thing to manage the math, it is quite another to communicate what the math means to stakeholders clearly, honestly, and with context. It’s also important to be able to explain the limitations of what your math work has revealed.

While I’m not an expert in probability and statistics, I had worked at conferences and workshops with performance testing luminaries Scott Barber and Ben Simo. I once spent hours in a conference hotel lounge with Ben Simo as he dumped game pieces on the table and would ask me to observe and describe what I saw. Little did I know that this data visualization practice would help me track down a nasty performance bug months later. I also took online courses, attended other workshops and talks, and tried out various tools. Once I was comfortable with generating suitable levels of load, working with the numbers started to take precedence in my work.

Basic Math and Exponentiation

Performance and load testing requires dealing with large numbers, and calculating and observing the effects of addition and multiples. While this sounds simple, it can be deceptively complex.

At its simplest, generating load against a test server requires generating multiple simulated users, which in-turn requires counting and observing. For example, if you generate 10 simulated users with a testing tool, you need to observe your test environment and see what effect that has on it. Does the machine work harder? What do CPU usage, I/O and other measurable aspects look like? For most systems, ten is a small number and may not even register, so what happens if you simulate 100 users? Furthermore, can the network infrastructure you are using handle that much load, or will it limit traffic in unintended ways?

Once you are absolutely sure that yes, your 100 simulated users are exercising the test server more or less like 100 real users would exercise your production server, now you can start to add on more. What happens with the 101st user? Nothing much? Ok, let’s add more and observe. The trick here is to find the point where unintended behaviors start to occur when you add that nth user to the tests. The temptation is to think of this as a linear graph, where nth amount of load will add n amount of server utilization, but that isn’t how this tends to work. What often happens is the nth user causes a surge in server activity, which looks like a geometric graph, or a hockey stick shape effect. Adding that nth user causes I/O to go out of control, or CPU utilization to stay at 100%, or memory usage to get used up, etc. In other words, that nth test user causes the system to get overwhelmed, rather than increment resource usage the way all the previous ones did. This forces us to move from thinking about addition and multiplication, or simple product calculations, and start looking at exponentiation.

Exponentiation in simplest terms deals with the rapid increase of numbers. This can occur in distributed systems for a lot of different reasons. There can be a massive influx of users for unpredictable reasons, there can be massive increases in utilization of hardware components, there can be data that grows unbearably large quickly … the possibilities are numerous. In other words, something unexpected happens, and suddenly there are huge numbers that are impacting things, and we get called in because these rapid increases upset the status quo, making things worse. This is a complicated topic with lots of discrete math concepts, but it is fun and rewarding to study, as long as you aren’t learning during a production outage.

Even simple product based calculations can be tricky, especially when small numbers can lead to large numbers. Without some thought and analysis, this can lead to poor results. Our brains struggle with large numbers (hence the need to create computers in the first place), and our shorthand for dealing with them can get us in trouble.

How many servers do we need??!??!??!!

One project I worked on required a backend overhaul due to the addition of a suite of mobile apps. The mobile apps used the existing server infrastructure differently than the legacy suite of web apps, and there were some nasty load-related surprises. Trouble was, these surprises were major bugs that required architectural changes in the code base, as well as the server hardware. There was little appetite to address those issues due to cost, and politics, so they were deferred for a later release. In the short term, that meant that they had to severely curtail the estimates of simultaneous users per server with the addition of mobile app usage. (Note, when I say severe, I mean severe, as in a factor of 10 reduction of users.) The thinking was to get a couple of friendly existing customers to take on the mobile app product as beta testers, and then slowly roll on more organizations as the existing code base and infrastructure was updated. Trouble was, some of the sales people weren’t on board with this, because they wanted the potentially lucrative sales and commissions for that now, not months in the future. One salesperson returned from a trip with a friendly, major customer, who had signed up for an early release of our mobile app suite. There was great rejoicing. However …

One of the most important things I do when I take on performance and load testing projects is to read all the published claims about the system. That includes the README files, the release notes, website and other pubs, blog posts, and most importantly, any contracts with user and performance commitments and SLAs (service level agreements.) I asked for the contract that the sales people had signed with the customer, and I was horrified. They agreed to an enormous number of licensed users, starting modestly, but increasing at 3 month intervals over two years. The numbers didn’t look too bad at a glance, but when you factored in that they committed to doubling, tripling, quadrupling, etc over time, it was cause for concern. The lead architect and I spent a few minutes calculating what these commitments looked like in server requirements, and the numbers were insane. If we were to support that number of users without substantial work and massive performance increases, it would require thousands of web servers to support the commitment of one customer.

Getting to the bottom of this required a bit of digging.

It turned out that the lead sales person who had signed the agreement said he had approached QA for information about how many simultaneous users we could support on the test server. He then went to IT and asked how much more powerful the production server was. Since they said it was at least 10x more powerful, he took the QA quote, and multiplied it by 10. He then massaged the numbers to increase to the extreme level to sweeten the sales offer, assuming a massive increase in performance every six months for two years. Of course when he talked to QA and IT, he did not make it clear what he needed the numbers for. We had to explain that you can’t take raw numbers that a server can sustain for a short period of time before crashing, and then multiply it and assume some sort of “half Moore’s law” for the product.

In the end, legal and senior managers had to approach the customer and try to salvage the sale. They were able to renegotiate the contract SLA into something achievable and sensible. It wasn’t pretty, and the company lost money, but they thankfully didn’t lose the customer. It could have been a serious outcome though, with lawsuits and other potentially calamitous outcomes.

Calculating and Communicating Probability and Statistics

The real fun of performance and load testing for me is in the various ways we can use math to uncover important problems. It can also get a bit messy, since we aren’t dealing in absolutes, but in likelihoods. There is some experience involved in how to manage the uncertainty, and that comes with risk. Taking some calculated risks with the math you use can help your clients greatly reduce the risk in the operations of their systems. I used to really enjoy that uncertainty, using mathematical tools, observation and background knowledge to help inform recommendations, and seeing those ideas pay off in better customer service. The only downside is that when you have in-depth work in this area, you will yell at your computer screen when you see polling data, media articles or marketing campaigns that get it wrong either purposefully to manipulate, or due to a lack of research.

What metrics can we publish?

One system I was brought in to test was updating to support a significant higher number of mobile users. They needed to publish some of their user metrics, especially within contracts that required licenses. They wanted to provide a safe number of simultaneous users for customers who were hosting their solution themselves, so they would know what to expect and plan accordingly. This is straight forward, but from a statistics perspective, it adds a lot of complication and time to our work. It is one thing to find problems to fix, and to anticipate what you need for your own systems, it is another to make commitments about that to others. For example, if you have too much traffic on your own system, you can quietly add more capacity and no one needs to know. If a customer who hosts your solution is budgeting for servers, they need to have specifics. Also, if they end up with more traffic than they can handle, you might be on the hook, determining on what claims you have made in your SLA.

Company leadership understood what I needed and were willing to provide everything, including a safe test network. What I had to do was determine safe, but enticing metrics that marketing could use to publish in advertising, and sales could use in service level agreements for contracts. The key was, how many simultaneous users could they safely advertise, and commit to supporting legally? The way forward with this task involved a lot of simulation, and a lot of math.

I started by analyzing their legacy product and their website traffic metrics. Unfortunately, the data seemed to be off somehow. When I asked for more information, it turned out that the data I wanted was from two different sources. To make up for that, IT had been asked to add the two datasets together, and divide by two, providing a sort of average. Unfortunately, this isn’t the way to approach this kind of data. When you are dealing with two separate, but related sets of data, it is sometimes called bivariate data. The reason for this was a bit complicated, but imagine that you could get a dataset for web browsers only, and then a dataset for operating systems only. You can use some deduction on this data to get a better sense of the reality of the metrics. For example, if you are seeing lots of Safari browsers, then you know you are dealing with Apple devices only. But if you are seeing Chrome browsers, they will be Android devices, but can also be Apple and other operating system providers. The “averaged” data provided earlier skewed the data in unintended ways because it didn’t account for those proportions.

To cope with the bivariate data, I reviewed Chi-Square analysis from university statistics, and read up on how to analyze bivariate data accurately. I use spreadsheets a lot, so I found some youtube videos on built in analysis I could use there. Fortunately, while I was struggling with my calculations, a programmer who had worked with complex statistical systems was sent my way. He happily took over the task and used a more suitable approach. The numbers he generated looked much more realistic. With a bit of research we were able to find the proportions of mobile operating systems and web browsers, and our analysis revealed something similar in these metrics.

Phew. Our first math problem was out of the way. However, this had implications for our testing. We had to repeat certain tests to increase our confidence in our analysis. I’m simplifying for the sake of brevity here, but essentially, we needed to figure out a realistic sample size, and calculate our margin of error, or confidence interval. It got a bit complex, and meant we had to have a production snapshot available for a few days and did nothing but re-run subsets of our load tests on it, and analyzed results based on our prior calculations.

Next, we analyzed the new system that would support much more mobile traffic. What might change now that we had better mobile support? Would the proportions of OS/web browser remain the same, only increase in amounts, or would traffic behaviour change completely? Since most people like to use their mobile devices first, we felt that it could have a much larger impact than just increasing the same traffic as the legacy system. The behaviour and type of traffic could change significantly. This was a prediction, or a hypothesis, and we needed to research published metrics of mobile usage when web sites became more mobile friendly to help bolster that prediction.

While we were researching and adapting our tests to better reflect production data, I was extremely fortunate to be on-site during a system outage. I was able to view errors, request snapshots of server logs, server utilization and other metrics, and anything related to data. What are queues doing, are there problematic processes, tables filling up, etc. Also, we were able to gather hardware and network infrastructure information. After the initial problem solving to get the system back up, failure point analysis and bug reports, we were able to pour over the data to get a picture of the weak points in the existing system. This also required some math, since server utilization and other metrics have different formulas. One type of hardware might use one set of metrics, while another might use something that sounds similar, but uses different calculations. In other words, a “one” might be a great measure for one type, while another might use a percentage, like “97% utilization”. Furthermore, “97% utilization” might be a good metric for one service, but a red flag for server CPU usage. Furthermore, monitoring a web server vs monitoring an RDBMS vs network activity can be very different. Also, different applications can behave differently, utilizing different infrastructure and services depending on their unique needs and client load. Context and an understanding of what tools to use and what the metrics mean is vital.

We identified problem areas in the existing system, and then created conditions in the test environment to reproduce this at lighter levels of user load. Then, we used real mobile devices with different OS and web browser combinations and captured their traffic information so we could add those into our load tests. We then used simulated mobile clients to analyze the system and observed how and where the increased mobile clients would impact the servers. Next, we figured out how to artificially create some of these unique conditions in key areas of the system. For example, we created tools to eat up machine memory, or to cause database queries to slow down or even hang. We tried to determine how an influx of mobile users might use the system differently, and created tests based on typical user scenarios mobile users would be interested in. We also determined peaks, such as peak usage by number of simultaneous users, as well as peak usage with regards to system utilization. This is important, since a lot of simultaneous users reading a marketing release is easier to support than fewer users who are taxing the system using applications. From there, we got a good sense of what how the system behaved under heavier load vs. lighter load. Once we had a suite of tests that had a good mix of mobile and PC users, doing simple things and more complex things, we were able to simulate our projected system behavior, once it was released into the wild. We could also force conditions that could be problematic, so we could determine outcomes with various combinations of things going wrong on the back end. For example, what happens if an influx of mobile users all do the most taxing thing that could be done to the system, from a user workflow perspective? In other words, we were modeling expected server behavior based on both web and mobile application usage.

Finally, we worked on what areas we were going to measure. Management had asked for the greatest number of simultaneous users that the system would support, but this is a bit too vague. It is one thing to measure how many users can connect to the home page, versus how many users can use the supported apps, versus a combination of browsing, lightweight processing and apps that require heavy processing. Furthermore, while a server might be able to handle many users without crashing, if the performance is poor, people will get frustrated. Similarly, a server may handle a certain level of traffic for a period of time, and then stop performing adequately, either by slowing down considerably, hanging or crashing, etc. Or, a server may manage many multiple users, but it may become unreliable, also negatively impacting their user experience. To determine what to measure, we needed to utilize the following related testing approaches:

  • Load testing
  • Stress testing
  • Duration testing
  • Performance testing

Load testing is about generating a number of simulated users, and analyzing the system. Stress testing involves simulating enough traffic to push the server to its limits, or to failure, in order to learn limitations, what behavior to be aware of in production, etc. Duration testing involves load testing over time. Finally, performance testing is all about the measurement. It’s one thing to survive load, stress and testing over a duration, but qualitatively, how is the performance? What measures can we do to signify “good”, or “adequate”, or “poor” performance? We determined to measure average times of connections to the website, and the duration of completing the most common tasks in the mobile apps. That meant we did the typical web measure of simultaneous users and page load times, but we also timed how long it would take to do important things. That said, we needed to be wary of averaging these values too quickly, since outliers are important to find and identify the underlying cause. Once we had a reasonable sample size we performed calculations such as standard deviation in addition to spotting outliers and repeating conditions to cause them and verify when they were eliminated. For example, one issue we ran into was a nasty database table that required a lot of processing time to read, write, update, etc, and that could impact the load times at seemingly random points in user workflows. Once we found a fix, a subset of time delays on certain pages were eliminated.

Next, we analyzed mean, median and mode for each of our measurement points. Mode is one of my favorites for analysis, because it shows the frequency of a result, which can look different when graphed than a mean or median. A mode can show a cluster points at unexpected parts of a graph, which are a sign that there is a performance problem that needs to be addressed. Once averages of our data are calculated, based on sample sizes that are sufficient, I then use one of my secret weapons: percentiles. Percentiles can be used in several ways with performance testing. A percentile takes a portion of the results, which you can then analyze as a subset of your full set of data. For example, with the 90th percentile, you eliminate the top ten percent of your result set, and look at the remaining 90%. I have found a lot of performance issues in systems using percentiles to analyze and visualize data that weren’t apparent when using the full data set. This works because the top results can skew the overall results, pulling the graph in an area beyond the mode, for example. There are several ways you can use percentile to find patterns and problems that are shown in test data, but this is one I use a lot to troubleshoot. I often use the 80th, 85th and 90th percentiles in various ways to find unexpected results in the data. Those three work really well for me to find problems that get flattened out when using 100th. Percentiles are used in other ways in performance testing, but this is a potent analysis tool when you are finding problems.

Once the system was tuned, anomalies discovered and reduced, and the response times are fitting in a normal distribution that coincides with mean, median, mode, etc. then we are ready to measure and communicate metrics. First, we need to create a sample set of test results that is reasonably statistically significant. We don’t necessarily need to have a great deal of rigour with these calculations (such as statistical significance), but we need to run the tests enough times to have confidence in them. For example, running the tests once is not enough for a sample set of data. On your project, running them 100 times with the same build, the same equipment and conditions, etc. might be large enough. Or, you may need to run them a thousand times. In general, the larger the sample size, the better, but diminishing returns can kick in too. This requires some experience and judgment. Other projects may budget for the time and expense to do an auditable, full set of statistical calculations. I will use percentile here again, but rather than using it to look for problems, I am using it to assess the validity of the set of test results we are working with. If I find something surprising, then there is either a bug we didn’t encounter, a server misconfiguration, or a problem with the tool or test environment itself. Once we are happy with the sample set data, we can start capturing metrics and generating reports. (Reporting results could take up several blog posts to cover, so I will just touch on it.)

Determining server performance metrics that we want to commit to isn ‘t an exact science. Our test environment is rarely identical to a production environment, and no matter what we do to distribute simulated test users, etc, we aren’t completely emulating real world conditions. As a result of the statistical calculations, and analyzing the probabilities of events occurring, we tend to deal with percentages. “We guarantee a 99% up time” is a common one we see in marketing materials. They don’t say “100%, because there are so many factors beyond their control that might temporarily cause down time. Server up time is a pretty simple metric to measure and communicate, whereas performance is even less exact. For example, in testing, 90% of users may experience page load times of a certain average, or falling in a certain range, 90% of the time. Furthermore, the metrics we publish to brag about versus the numbers we are legally required ot meet might look very different. For example, we may find that a certain type of server configuration is adequate for performance targets, using a certain number of users. An aggressive approach might be to publicize one particular set of data that is attractive. We reached that level once, so we will tell the world we can do it. When it comes to SLAs though, we will likely be much more conservative. In some cases, an average is determined, and then some breathing room is built in those metrics by diminishing them, just in case of some events in production that weren’t apparent in test.

Communicating and reporting results requires skill and experience. Figuring out what is useful to measure, how to accurately analyze and interpet those measurements is part of the picture, but communicating what that means, what the limitations are, and providing advice on how to proceed is much more difficult. It’s one thing to do the math, and it’s altogether another to do something useful and helpful with it.

Lies, Damned Lies and Statistics

One of the great side effects of load and performance testing is how formerly intermittent bugs start to become repeatable. This is due to high volume test automation, one of the most powerful and useful test automation approaches you can use. While it is often unintended, adding load starts to cause problems to bubble up. This is so common, I always recommend teams schedule time around their load and performance testing efforts to deal with the inevitable issues that crop up. This is a good thing, because it helps improve the overall system and the end user experience with your software. In the short term though, it can be frustrating and might threaten schedules. These problems tend to require time and effort to fix, so while testers get excited, project managers start to get nervous.

One performance testing project I worked on had a particularly nasty “unrepeatable bug.” Once in a while, a tester using one of the web apps would experience a crash. This crash would also cause the test web server to hang, requiring a manual restart. No one was able to repeat it, so it was put into the state where bugs go to get forgotten, otherwise known as: “We’ll monitor it.” One day, the QA team installed a major new build. The team was getting ready to release a new version of the software with some new features and important bug fixes included. We started to run our automated tests, and testers began to work through their daily tasks. Suddenly, there was the familiar crash, and the required server restart. We had four test servers at the time, with one dedicated to our load and performance testing, with the other three available for other testing work. The testers moved on to a new server as the frozen one was restarted, and then the bug happened again, a tester saw a crash report, and the server froze up. Now there were two. Once again, a server froze up, and the testers were all on one test server. It crashed, and so did the load testing server. “That’s odd.” At one point, we had all four test servers requiring a restart at the same time, and this was causing serious productivity issues in QA, not to mention the implications for the new release. We raised the issue with the product and project managers, and started to analyze it.

The testers all kept track of what they were doing when they saw the bug, but we quickly set that aside. There was a factor in the system that wasn’t observable through the UI that was the likely culprit. We started to monitor the servers, turned up logging to get more information, and when a crash occurred, we tried to investigate every component of the web infrastructure on that server. We used low level load testing traffic on the each of servers to cause the bug to occur even more frequently. It took a couple of days, but we realized there was a strange race condition, where two services were utilized at exactly the same time. In the previous version of the software, this happened infrequently, but now, it was happening a lot. But, at least we had a repeatable case, and with the aid of our automated tests for load testing, we could repeat it on command, within five minutes. That gave developers the opportunity to run their debugging tools and track the issue down so they could fix it.

Trouble was, the fix was not an easy one, and was extremely political. To fix the problem required some major architectural rework, and re-opened a major debate on the development team. There had been bitter disagreement on a particular direction, and the one that was chosen was not popular. Now that the unpopular architectural decision was shown to be problematic, the issue blew up. There were heated arguments, lots of negative back channel chatter, polarization over possible solution ideas. All of this caused a lot of hurt feelings and resentment on the team. Some minor server setting tweaks were proposed, and each of them helped reduce the frequency of the bug somewhat, but didn’t reduce it enough. The team now had a choice: proceed with the release as-is, delay the release to try to find a temporary fix to reduce the occurrence more, or put the release on hold until the rework could be done to remove the problem for good. I was tasked with coming up with an impact assessment to help management determine a course of action. Here is what we observed, so I recorded it:

“Intermittently, a catastrophic bug causes a web server to crash, requiring a reboot. This means that once the bug occurs, the server is not available for users until it has been restarted. It doesn’t corrupt data, but it deletes the work that the user was currently working on, so they have to start over. The user will see a crash message, and once they refresh and connect to a new server, they have to log in again, and start over. In the meantime, there are fewer servers available, which means that at times, some users are unable to connect until someone else logs off. We found that on average, one in five users who connected to the server would come across this bug. This is a high probability issue, and it affects more than just the person who triggers the crash, the server is now unavailable for anyone until there is IT intervention. It costs time and money, not to mention the extreme frustration of the users who experience this. With self-hosted equipment, there is time required by IT to go and reboot the server, often several times a day. With cloud-hosted infrastructure, moving to new servers could cause expenses to increase significantly.”

Unfortunately, the people with political power did not want to fix the problem, they wanted to release. They took my 1 in 5 occurrence metrics and reframed it. While it wasn’t technically a lie, they greatly minimized the impact of the bug. This is what they told senior management:

“There is a severe bug that QA have found a repeatable case for, but it is going to hold up the release to fix it. The bug only happens 20 percent of the time!”

They also heavily implied that it was happening in the test environment more frequently because the QA team were abusing the system to find more bugs. Technically, we were using load testing tools to generate very light levels of load, but they didn’t say that. “You know how QA are, and they are also running load testing!!!” which made it sound like it would happen more frequently in test than in production. However, we were extremely worried about how often it could occur in production, with thousands of users, instead of the 15 testers and light load we were generating in the lab. Senior management decided to move ahead with the release as it was, and take a risk on the bug not occurring at all, or occurring infrequently. Why did they do this?

A 1 in 5 chance of something occurring is quite high. So is 20%, but twenty percent sounds smaller. If you use that figure without context, and your attitude is to make it seem small and insignificant, people will generally interpret it according to how you spin it. A 1 in 5 chance of the bug occurring in production, could mean that 200 people out of the first 1000 could experience this bug. It wasn’t uncommon for client sites to have dozens or even hundreds of simultaneous users, and our servers would peak at 1000 simultaneous users at times. If you think of 200 people seeing this crash, and then many people having to log in to a new server and start over, until license or server capacity was filled, with the system being unavailable for everyone after them, it starts to look more serious. However, the political players decided to just say “It has a 20% chance of occurring.”

The product management lead approached me and asked for a second opinion. I had to tread carefully because of the political implications of what they had been told, but I explained that even a 20% chance is sky high. For a bug like this, we could risk a 0.02% (zero point zero two percent) chance. Even a 2 percent chance would result in outages that would anger our customer base. For example, if you were gambling in Vegas, you’d take a 20% all day long. Those are wonderful odds if you are gaming. To hedge their bets, I advised that they create and rehearse a roll back strategy in case the new release was as bad as we expected it to be. Thankfully, the team followed that advice, because the release was a disaster. Every client site had no access at all by mid morning, which meant that our IT and customer support teams were busy 24 hours a day, dealing with extremely angry people. The release was rolled back, and the difficult architectural change was implemented, and the bug disappeared. It was weeks of effort, but if they had decided to wait on their release, they would have been much better off than unleashing something so unstable to the public. They lost a lot of money, they lost face publicly, and they lost some customers. They also lost months of time on their product roadmaps, since everything ground to a halt to address the customer anger and problems, and then efforts were split between support and fixing the problem.

The most expensive combination were the cloud based hosting services of the system, in some cases causing a huge increase in hosting bills. When you couple a frequently occurring server outage and a wish to fix the problem quickly with an extremely easy way to add more servers, you can quickly end up over your hosting limit and incur costs. As you might imagine, there were some extremely angry customers whose IT teams fell into the “just add more” trap to try to minimize the problem.

What went wrong? Someone decided to use metrics to try to spin a narrative that was counter to reality. This happens all the time in the world! It is almost always by people who want to minimize the problems highlighted by scientific rigour, or to try to maximize public support for unpopular policy. Or it is used by people trying to sell you something. The concept lies, damned lies and statistics explains how metrics can be used to spin a narrative. It’s important to question narratives, especially if they lack context. What can go wrong? Who wins and who loses when a particular course of action is taken? Are methodologies with weaknesses and strengths explained, or are they glossed over? Is the person presenting the data a relevant authority, or are they just a good talker? What happens if you scale up the numbers (if they are small), or scale down the numbers if they are large? Does the message change? These are all important questions to ask yourself when you are shown data that is supposed to convince you of something. The math lesson here is how you communicate metrics is important. Spin can blunt a serious issue and problem minimizers can win out of they are clever, albeit dishonest, communicators.

Load Testing Your Web Infrastructure: Please Be Careful. Part 3

In the Part 2 story, we saw what a load testing tool can do when it is used by someone who doesn’t have the right knowledge and skill about the tool and underlying systems. However, you also need to understand the environment where you would need to use the tool. Creating and using test environments that are optimized for load and performance testing is a must. If you use these tools on a regular network, you will likely disrupt everyone else at the office, causing lost productivity and extra work for IT staff. The last thing you want to do is try them out at home, and end up blacklisted by your ISP (internet service provider).

Bye Bye Network!

After a while, I was an old hand at load and performance testing. To bolster my hands-on experience, I attended workshops on how to overcome technical restrictions, how to accurately analyze the data and find problems others would miss, how to write reports and describe risk and problems, and I was adept with a handful of tools. I started to get hired for performance and load testing gigs, and under the right circumstances, I had some rewarding and fun projects. I worked with a lot of talented people with vastly different skills, and learned from each of them.

Since I had a lot of retail and telco experience, a work friend asked me to come in to help him with a large retail system that was going through an upgrade. One of my tasks was to provide load testing help, since they were upgrading all the software and hardware for their back end system. I was given a lot of freedom to choose the tools, to interview everyone I could about any backend system issues, how to simulate credit card processing, etc. I was given a lot of freedom to research and design exactly what they needed. However, I was not given a test network to run the tests, so I never used any load. I verified my load tests would work with only one user.

To find potential areas of concern, we set up monitoring at several key areas on the system, and I had test results output in a format we could utilize with statistical analysis software. We also monitored server utilization, and recommended moving some processes around to better utilize the system. We learned a lot, but I wasn’t ready to unleash full load testing capabilities without a dedicated test network. There was no way I wanted to use this on the corporate network, even though we knew it would only run against our internal test system. I knew from experience that we could overload the internal network and cause problems for others. My friend, the dev manager, ignored my concerns. He was confident that the internal network would handle the extra traffic, since the IT admins had shown him that it was perpetually under-utilized.

Despite my objections, the dev manager insisted I run the load tests on the regular internal network. To start, he wanted to run the tests with 1000 simultaneous users, but I suggested we try something smaller. I wanted to try 10, he insisted we try 100. Still objecting, I hit the “Enter” key on my machine to start the tests. Immediately, a collective howl started to swell across the entire floor of the office. Then people started calling out that they had no network access. The dev manager and the IT manager ran to the server room, and when they unlocked it, all we could see in the dark rook was a sea of blinking red and yellow lights. Clearly, my load tests had overwhelmed the entire network, and every piece of hardware was in an error state. No one in the office was able to do work until all of the equipment was restarted. It took about a half hour to get the network up and running again, and the first thing my friend said was: “TRY IT AGAIN!!!!” He insisted the network outage was coincidental.

I refused to run the tests again, and made him tap the button on my machine. No sooner had his hand lifted from my keyboard, when the collective howl swelled again. The IT admin opened the server room door, and again, it was all blinky lights, and no network access for the company. It was remarkable how quickly the network was getting overwhelmed. Technically, the dev manager and IT team felt it was impossible, but they agreed not to run the tests again until we had investigated the source of the problem. Furthermore, permission and a budget for a test network specifically for load and performance testing was immediately approved by stakeholders.

It turned out that it was an extraordinary event that caused the outage, but it was something that would have happened in production without us catching it internally first. In simple terms, the network cards on the new servers had been set to a default to broadcast to each other when under load, to try to load balance. This was a new feature, that looked good on paper. However there was already had a load balancing system in place, so this was redundant, and harmful. In effect, the servers spammed each other because they were all under load, and the traffic increased exponentially. Machine one would find itself under too much load, so it would message machine two to get it to process excess. Unfortunately, Machine two was also under extreme load and was also messaging machine one, who was messaging machine two for help, as were Machines three and four, messaging each other over and over and over with more and more messages.

To visualize what they were trying to process and the traffic they created themselves, imagine a geometric or hockey stick curve on a graph, or an infinite series in mathematics. The load tests were already creating a huge amount of traffic, but the servers themselves were generating more network traffic at an exponential rate. This traffic generation behavior instantly overwhelmed every component in the corporate network. We quickly turned off that setting in the network cards of the test servers, and then waited for a test network we could safely run the tests on.

The next time we ran the tests, I had several managers breathing down my neck, but the server outages they caused did not cause any network outages. There was no collective howl, no server room full of blinky error lights. We all breathed a sigh of relief, and we went on a find and fix cycle for a few weeks to get the systems ready for a production launch. We were able to ship with a lot of confidence due to this work, and the load tests were part of pre-production tests for years after that launch.

This was a relatively small company, and the impact was fairly low. The entire development team and IT team sat together, and the infrastructure was in a server room on the same floor as the office. We were able to deal with the outages quickly, and the incident became a part of office lore, brought up when a laugh was needed. It wasn’t without political fallout though, since it was disruptive and problematic. Now imagine if this was a larger company, with IT departments in another location, servers at a hosting provider or on the cloud, etc. There could be considerable downtime, and increased costs with hosting providers, etc. While this situation was more lighthearted due to friendships and a tight knit office environment, it could have been extremely serious.

Part 4 story

Load Testing Your Web Infrastructure: Please Be Careful. Part 1

Now that I am on the product management side of software projects, I don’t deal with testing approaches in my day-to-day work very much. I get info about product quality criteria, quality goals and metrics, information on testing status and quality, or show stoppers that require attention. Unless I want to dig deeper, I don’t hear much about the actual testing work. Once in a while though, something big pops up on to my radar, usually because there is a threat to a product release, or there is a political issue at play. In those moments, my background as a software tester comes in handy.

Recently, my testing experience was called into action, because of project controversy about load testing.

There were some problems with a retail system in production, and poor performance was blamed. The tech team did not have the expertise or budget for load testing, and were instead pushing the sales team to take responsibility for that testing. The sales team didn’t have any technically minded people on their team, so they approached marketing. The marketing team has people with more technical skills, so a manager decided to take on that responsibility. They asked the team for volunteers to research load testing, try it out, and report back to the technical team. I happened to overhear this, and began waving my arms like the famous robot from Lost in Space who would warn about impending danger by saying: “Danger, Will Robinson!” This is out of character for me, since I prefer to let the team make technical decisions, and rarely weigh in, so people were shocked by my reaction. I will relay to you what I said to them.

Load testing is an important testing technique, but it needs to be done by people with specialized skills who know exactly what they are doing. It also needs to have test environments, accounts, permissions and third party relationships taken into account.

Load testing is a great way to not only find performance issues with your website or backend servers, it will also cause intermittent bugs to pop up with greater frequency. Problems you might miss with regular use will suddenly appear while under load, due to the high volume of tests that are run during a short period of time. High volume automated testing is extremely effective, and one of my favorite approaches to test automation. To do it correctly and to get utility requires work, environment setup, as well as knowledge and skill. Done well, performance bottlenecks are identified and addressed, intermittent bugs are found and fixed, and a good test environment and test suite helps mitigate risks going forward when there are pushes to production. However, when done poorly, load testing can have dangerous results. Here are some cautionary stories.

The simplest load testing tools involve setting up a recorder on your device to capture the traffic to and from the website you are testing. You start the recorder, execute a workflow test, turn off the recorder, and then use that recorded session for creating load. The load testing tool generates a certain number of unique sessions, and replays that test at the transport layer. In other words, it generates multiple tests, simulating several simultaneous users using the website. However, lots of systems get suspicious of a lot of hits coming from a particular device, and protect against that. Furthermore, internal networks aren’t designed for one machine to broadcast a huge volume of data. If you are working from home, your ISP will get suspicious if you are doing this from your account, fearing that your devices are being used for a Denial of Service attack. Payment processors are especially wary of large amounts of traffic as well. So if you use this method, you need to completely understand the system and the environments where you are performing the tests.

Part 1: Expensive Meaningless Tests

Early in my career, I was working with a popular ecommerce system. They were successful with managing load, but felt their approach was too reactive and possibly a bit expensive. If they could do load and performance testing within the organization rather than deal with complaints and outages, they could also improve customer experience. I was busy with other projects, and I had never worked with load testing tools before. Since I was a senior tester, I was asked to oversee the work by a consultant who was a well known specialist, who also worked for a tool vendor that sold load and performance testing tools. To be completely honest, I was busy, I trusted their expertise, and I didn’t pay a lot of attention to what they were doing. One day, they scheduled a meeting with me, and provided an overview. It all looked impressive, there were charts and graphs, and the consultant had a flashy presentation. They then showed me their load tests, and highlighted that they had found “tons of errors”. He said that his two weeks of work had demonstrated that we clearly needed to buy the tool he was selling. “Look at all the important errors it revealed!”

My heart sank. All they had done was record one scenario on the ecommerce system, and then played that back with various amounts of simultaneous users. They were wise enough not to saturate the local network, so they kept the numbers small, but their tests were all useless because they had no idea or curiosity about how the system actually worked. The first problem was that retail systems don’t have an endless supply of goods. Setting up test environments means you set up fake goods, or copies of production inventories that don’t actually result in a real life sale. To make them realistic, you don’t have an infinite number of widgets, unless you need that for a particular test. These tests didn’t take that into account, and the “important errors” his hard work had revealed with the tool were just standard errors about missing inventory. In other words, there were ten test books for sale, and he was trying to buy the 11th, 12th, 13th books. If he had been a real user using a website, the unavailable inventory messages would have been displayed more clearly. Because he was getting errors from the protocol level, they weren’t as pretty. A two minute chat with an IT person or programmer would have set him straight, but he didn’t look into it. He copied the messages and put them in his report, treating them as bugs, rather than the system working just fine, due to his error.

Next, they were using a test credit card number that was provided to us by the payment processor. There are lots of rules around usage of these test numbers, and he was completely oblivious to these rules. In his days of so-called analysis of our system, he had not explored this at all. That meant that our test credit card numbers were getting rejected. This was the source of some of the other “important errors” he had found, but not investigated. This was so egregious to me, I had to stop the meeting and talk to our IT accountant who managed our test credit card. My fears were confirmed – these load tests resulted in our test credit card numbers getting flagged due to suspicious activity. That meant none of us could test using the credit card, and we had to have a meeting explaining ourselves and apologizing to get them reinstated.

I got dragged into developing my own load and performance testing skills because of this. The consultant went back to the office, and I inherited these terrible tests. What I found that was while the load testing tool looked impressive, it had this terrible proprietary programming language that created unmaintainable code. While it had impressive charts and graphs, they were extremely basic and could actually mask important problems. Recording HTTP(S) traffic and playing it back could be fraught with peril, because the recorder is going to pick up ALL the HTTP traffic on your machine, including your instant messages, webmail, other websites that are open, and 3rd party services such as a weather plugin or stock ticker. Also, you need a protected test network that prevents you from causing problems and interfering with everyone else’s work. Then, you need to look at your backend and see what is possible. In my case, I worked with the team to create new load test products on the website, but the backend retail system only allowed a maximum of 9999, since it maxed out with a 4 digit integer. We also had to create a system to simulate credit card processing, since the payment processor wasn’t going to allow thousands of test purchases hitting their machine. Furthermore, our servers had DDoS protection, and would flag machines that were hitting them with lots of simultaneous requests and deny access, so we had to distribute tests across multiple machines. (These issues were all a bit more technical than I am recording here, but this should give you an idea.)

How much time do you think it took to create the environment for load tests, and then to create good load tests that would actually work?

If you answered: “weeks” with several people working on the testing project, then you are in the ballpark.

We also abandoned the expensive load testing tool, mostly due to it using a vendorscript instead of a real programming language. We used one that was based on the same language the development team used, so I would have support, and other people could maintain the tests over time. It was a bit rudimentary, but we were able to identify problem areas for performance, and address those in production. A happy side effect was the load tests caused intermittent issues that we had missed before to become repeatable cases that could be fixed. It was a lot of work, but it was the start of something useful. The tests were useful, the results were helpful, and we had tests that could be understood, maintained and run by multiple people in the organization.

I was fortunate in this case to be able to work with a great team that was finally empowered to do the right thing for the organization. We were also fortunate in our software architecture and design. We spent the time early on to create something maintainable, with simple tests. As a result, our testing framework was used for years before it required major updates.

Click here for Part 2 of the series.

Designing a Better Life

Often, my public work lags behind my current interests or passions. That’s ok, it usually catches up in time. However I wanted to talk about my current focus and passion right now: designing systems for a better life. If you read my blog regularly, you will notice a shift towards design, user engagement and other topics. I wanted to explain why.

This has been a tough year. I’ve been on the road a lot, and I have met a lot of fantastic people and worked with some amazing organizations. However, I have been away from my family and friends here at home, and I have missed out locally. The Alberta flood disaster forced me to look at my local, real life. This spring we found ourselves evacuated from our home, staying with friends wondering if the flood would wipe out our house and property. Unlike many others, we were very fortunate and came home to no damage, but it changed our perspective. A few days earlier, we took for granted that we had a safe, dry, secure home to always use as a refuge no matter what happened in our work or public lives. We came home and celebrated with our neighbors that we were all ok, and then we did what we could to help each other. I realized I need to do more to contribute to my local community as well as virtual communities.

The Alberta floods, like so many natural disasters, brought the best out in people. Organizers were turning away volunteers because they had too many, and entrepreneurial types turned their energies towards creating systems to harness that energy and that willingness to help others. I was amazed at how people used social media to mobilize people to work for a common goal and to help out others. Mobile technology wasn’t just about screen sizes and sensors and wireless conditions or merely staying informed about the emergency going on around them, (which was incredibly useful and important.) What was more interesting was the technology was helping people help others, and to mobilize together to collaborate. This is incredibly powerful. The technology enabled people to do something in real life. It wasn’t just about sharing pictures of food and videos of cats on social media, or wiling away hours playing Candy Crush or Angry Birds. This technology was exploited to make all of our lives a bit better as we lived through a natural disaster together. Those who were unaffected and wanted to help just had to grab their mobile device and utilize social media to find out what they could do to help. Those who were affected could get informed, ask for help or just read messages of encouragement.

Mobilization and collaboration to help work together to help others or to solve problems is an important area that I am exploring through human and technology systems.

Mobilization can be harnessed for helping organizations and groups of people solve really hard problems. Distributed computing can be combined with crowdsourcing to distribute problem solving amongst our most powerful tool at our disposal: the human brain. Projects like fold.it provide problems in a gaming context to help provide vital information for researchers who are looking at combating disease, or providing health care technology to improve our lives. These are enormous problems that have an impact on all of us. On a smaller scale, we can focus our energy and mobilize the people in our social circles to help us achieve health goals or recover from injury with the SuperBetter game created by Jane McGonigal. These are two powerful examples of how we can use technology and humanity together to solve problems.

Those of you who follow my writing know that this is an area that is important to me, even on simple tasks like test automation where I prefer human involvement in the computing work (see Man and Machine: Combining the Power of the Human Mind with Automation for more.) In the past, we have tried to outsource difficult problems to machines, and now we are learning better ways of getting the best of both worlds – the computing systems support us and do what they do well and enable us to really take advantage of collective wisdom and interests. I think we are just scratching the surface on this space.

Distributed collaboration to solve really hard problems is an area I am looking into more.

I’ve done a lot of work with mobile applications, and many of you are familiar with my book and course on testing mobile applications. I have trained hundreds of people, and many more have read my ideas about testing mobile apps or web experiences, but that is only part of the picture, and I do a lot more in this space than my public work suggests. To create a great mobile experience, we need vision from business leaders on how they want to use the tech – are they merely supporting it, or are they embracing mobile technology to transform their interactions with the people they are trying to help? Are they looking at mobile as something they are forced into, or are they looking to it as a new area to help increase revenue and loyalty? If business leaders are reluctant, that vision (or lack of vision) will make its way all the way down through the project, and ultimately in a poor customer experience. On the other hand, a great mobile vision is only as good as the technology that was chosen, the design of the application, and the quality of the customer experience. I have been helping organizations to create great mobile experiences in each of these areas.

A quality mobile experience requires great vision, careful choice of technology, a design that engages customers, and is reliable for people who are on the move in the real world. That reliability also depends on great design, programming and testing. That quality experience can’t be tested in at the end, so many organizations are asking for my help in other areas, such as a mobile strategy from an executive level, how to choose the best mobile technology to fit that vision, what areas need to be addressed in mobile design, and then quality practices in programming and testing. This is a fascinating area to work in, because there are many more areas to be aware of than we are used to in software development.

A fantastic mobile experience from project vision, design and execution on down to you, the person holding the device, can make your life easier, but a poor quality experience can ruin your day. I am learning how to improve this experience and I want to show you how you can too.

Some of you have wondered why I am talking about things like gamification. I am less concerned about the gaming aspect, I am more concerned with what lessons we can learn from this field with regards to collaboration and finding meaning in what we do. Modern knowledge work can be difficult to deal with over time. If the power goes out, all our work disappears, so many struggle to find motivation and meaning in their work and careers.

To me, gamification is just one of several potential models of engagement, and we can use it in different ways. If you are in a job that is difficult and you are losing hope, don’t be threatened if I talk about gamification. If making your work more like a game fits your context and your personality, as well as the people working with you, then yes, we might look at creating some sort of Alternate Reality Game (ARG). Always know I would never force that if you weren’t interested, or if it wasn’t appropriate. However, I may use mechanisms that I have learned from game designers to help with areas of work that are difficult, feel hopeless and don’t have meaning. If I do it correctly, you won’t recognize it as a game – I won’t just put up superficial gold stars and leaderboards, or worse, trivialize the important work that you do. I may however, collaborate with you to create something to help you get more meaning in what you do using engagement or other concepts I have learned from games.

That is vital in human and software systems that people work with. Can we make this activity or program engaging so they want to use it more? Can we design the system to not only solve the problems of an organization, but also to help reinforce meaning in what people do? Gamification is an interesting and powerful area of research, with a lot of potential for good, but it can also create harm. I am carefully researching how I can use this in my own work, because it is one mechanism that I see to help do something more for us.

Studying engagement models and finding and experiencing meaning in the things we spend our days working at is important and I am spending more time looking at how the intersection of software and people systems can help.

Design principles are another area of research and problem-solving for me, which are often under the umbrella of UX (User Experience). Creating great software experiences can really help us since we interact with it, or it affects us indirectly in everything that we do. A better software or computer system experience has an enormous impact on our lives. When they go wrong, they can really cause problems, but a simple, elegant solution can bring joy. User experience and design in an era where wireless and sensor technology is common, touch and gesture interaction on different technology with different screens is hard enough. What do we do when nanotechnology and other distributed or pervasive systems become much more common? I love the research and work in this space, and it is a part of what I do on projects.

The challenges we have are fascinating, so product management and product design are areas of project work for me, and what I am increasingly spending time on in my spare time.

Some of you have heard me talk about health projects. One of the most rewarding projects of my career was working on a medical program for mobile devices. It was great to try to break new ground with new technology, and determine how we could make health-care professionals lives easier, and to enable them to provide better patient care. My Mother still works as a medical professional, it is a calling, and we tease her that if she refuses to retire, she’ll pass on “in harness”. She is absolutely fine with that, she is committed to her work and patients, and takes courses every year on areas that interest her, and how to better use technology in her own work. She has passed that down to me, and finally as a professional, I have had some chances to help create better software for medical professionals. I enjoy working on medical software because I can see how we are contributing to actually make people’s lives better. When we do it right, we enable others to do great work, solve difficult problems and help real people. It’s easy to find meaning when your work has an impact on others, and we can do so much better with technology and health than we have been.

Systems that help us live more healthy lives are an area of keen interest for me, and I am interested in mobile, games for health, distributed computing, crowdsourcing and all sorts of things in that space. Healthcare professionals like Anna Sort inspire me with their creative and innovative ideas that they turn into action, and programs like Strokelink to help stroke patients using mobile technology are great.

I’m also interested in how we can create software for health professionals that is easier to use, more reliable, and enables them to focus on patients and not fight with systems that don’t take them and their unique context and work as well as the environment they are working in into account.

Finding ways to use software and related technology in health care and health research is another area of huge interest for me.

So there you have it. Watch this space for more of the above topics on how we can explore the intersection of people and technology to help design better lives for ourselves.